Performance
Target$40
Actual
$50
+25% Above TargetYour results.
Your goals.
We compare performance against your KPIs and show the gaps.
Platform Review ↗
Free Why People Buy™ ROAS evaluation for food & beverage brands: shopper psychology + media audit in one. Pinpoint where you're losing buyers, fix acquisition gaps, and increase your ad return heading into 2027.
See the performance gap.
Find your overlooked buyers.
Real everyday simplifiers.
Your biggest audience.
Your smallest spend share.
Test the segment you’re missing.
Reach everyday simplifiers with convenience-led creative.
Client engagements using the Why People Buy Pyramid™
See how your ads perform, who’s buying, and where your targeting falls short.
Performance
Actual
$50
+25% Above TargetWe compare performance against your KPIs and show the gaps.
Platform Review ↗
Customers
We map your customers to the Why People Buy™ Pyramid.
Customer Segments ↗
Targeting
↗ A gap worth exploring.
We compare customer segments with ad spend to reveal targeting gaps.
Targeting Assessment ↗
One evaluation, two engines
1 · Shopper motivation
2 · Media efficiency
Result
Predictable, scalable growth into 2027.
Three steps to a clearer picture of what to test next.
Your brand, one ad platform, your KPI, and the customer info we need.
We review performance, map customer motivations, and check your targeting.
Your main finding, the gap, and one recommended test. All on one page.
Whether you work with us or not.
We use the Why People Buy Pyramid™ to segment your existing customers by what motivates them. Those segments give us a way to assess whether your advertising is targeting the right people, from practical needs to identity and shared values.
Higher layers build on the basics. They don't replace them.

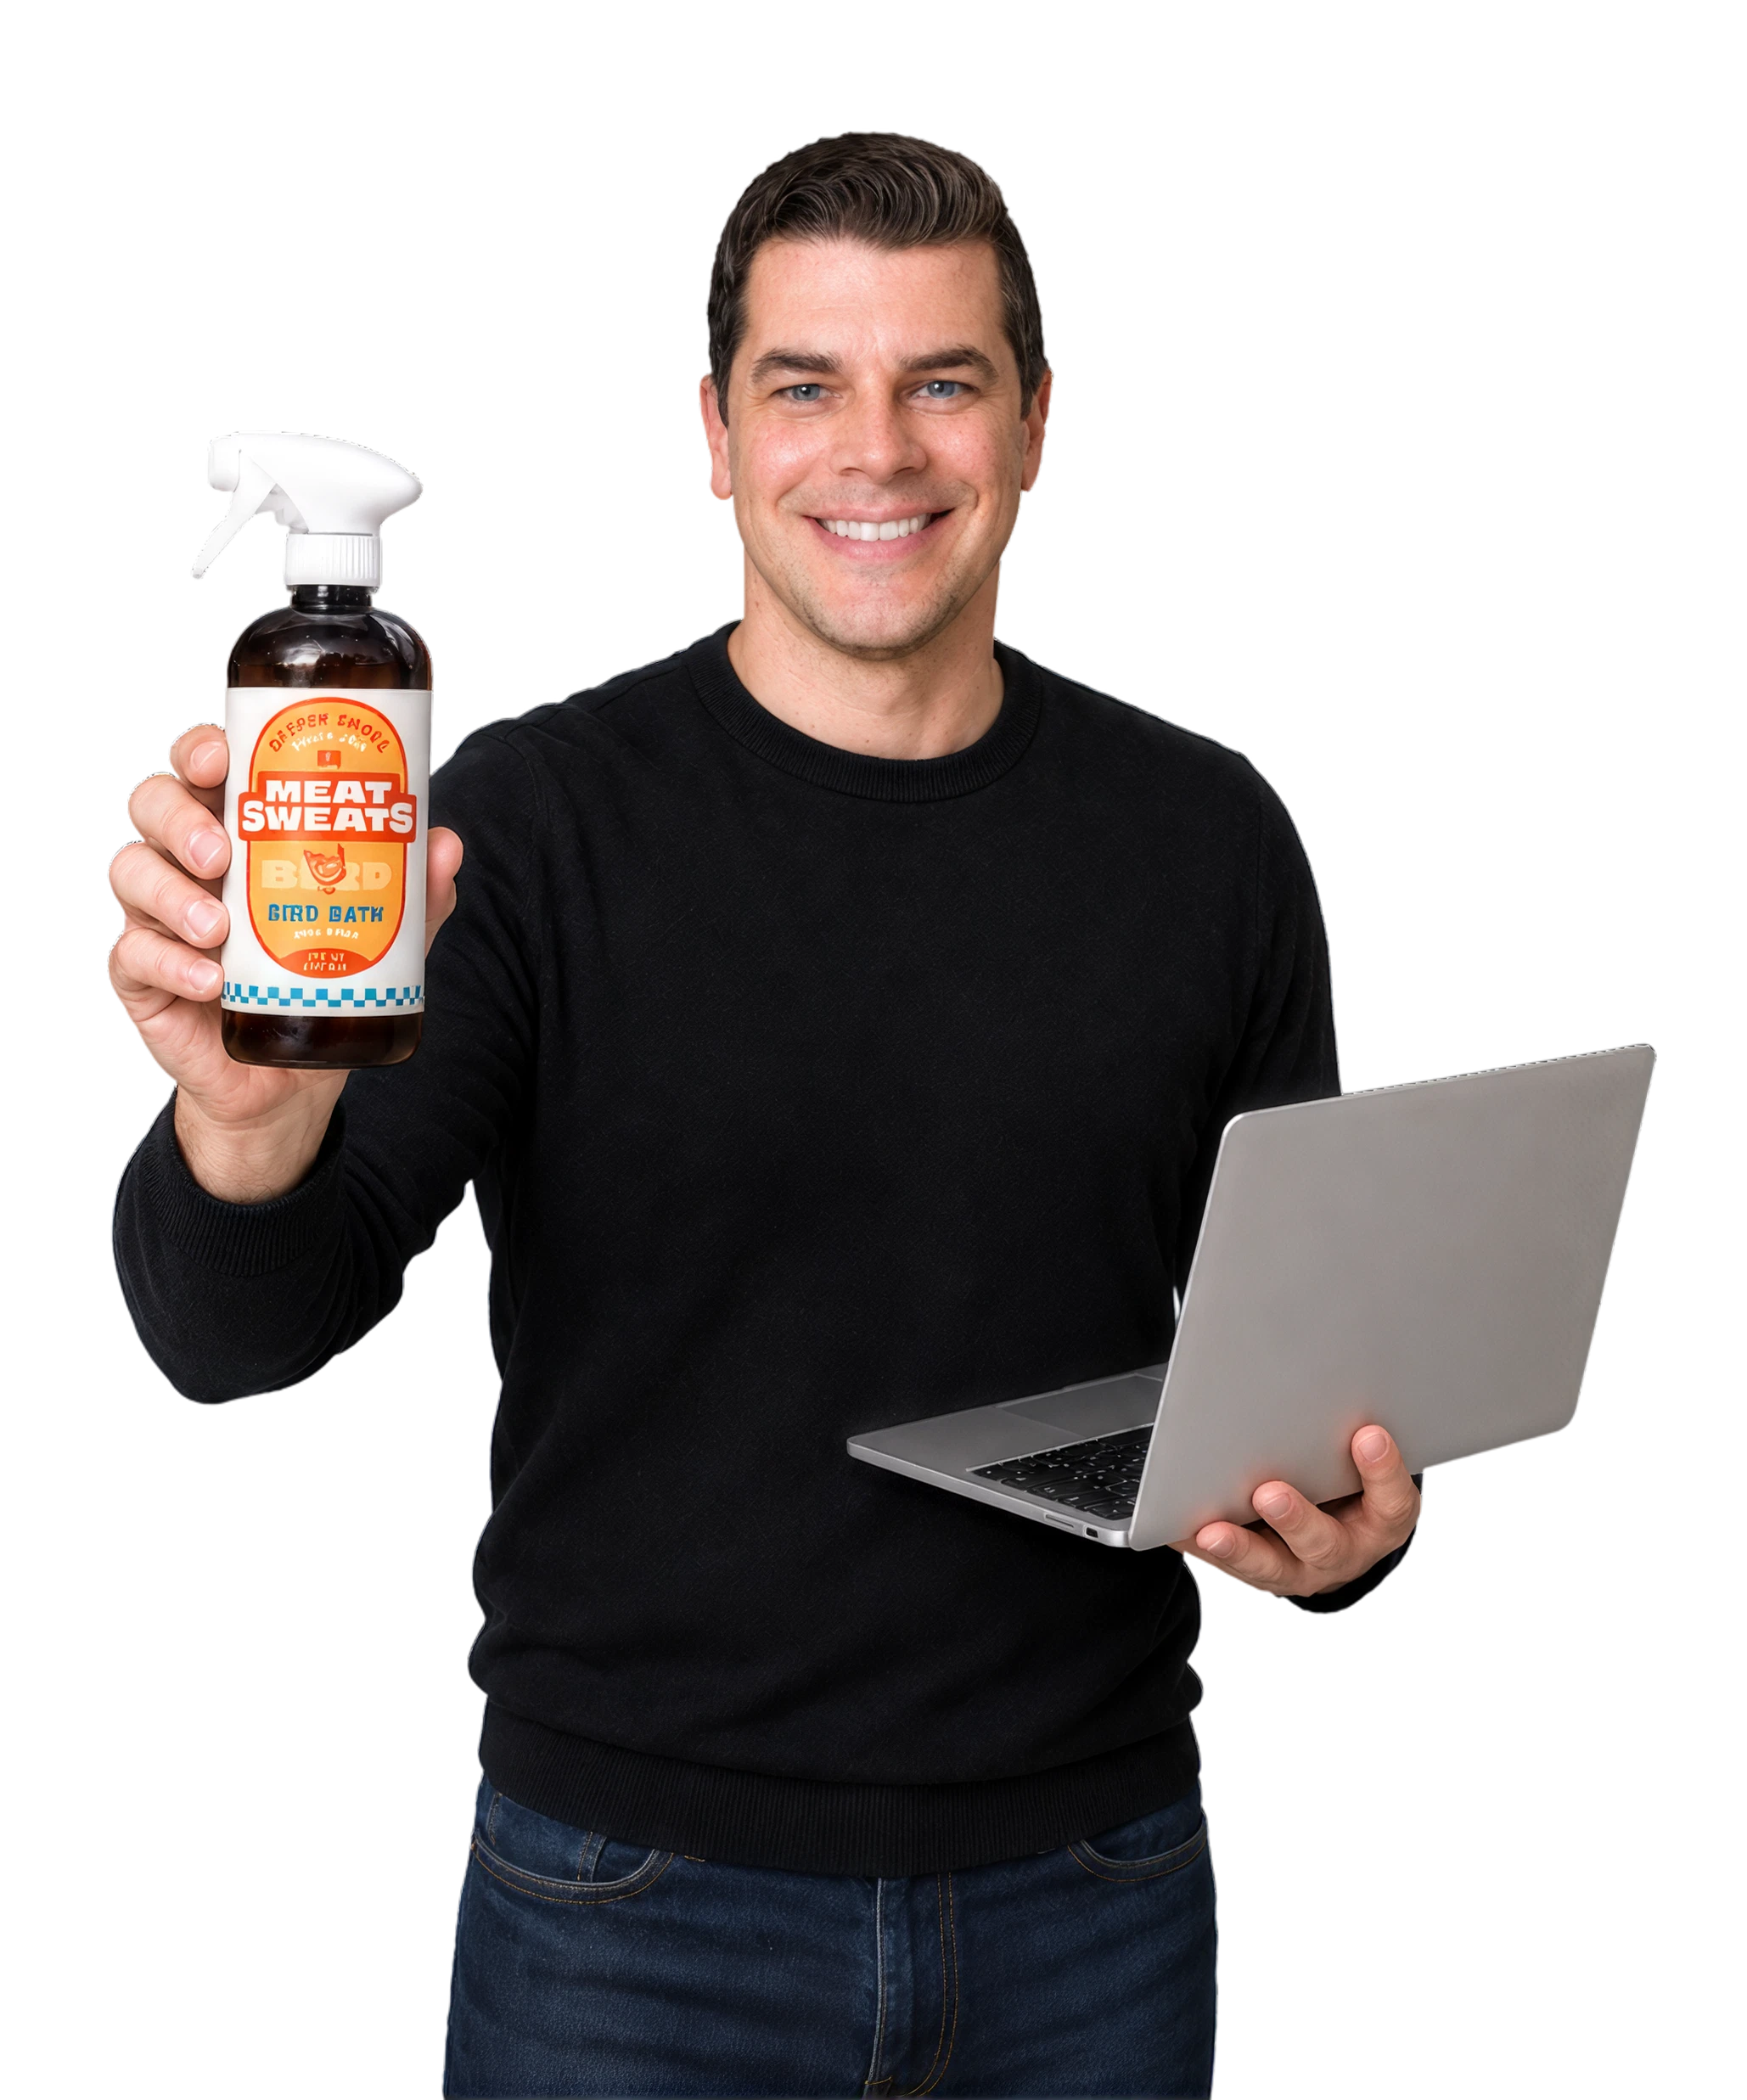
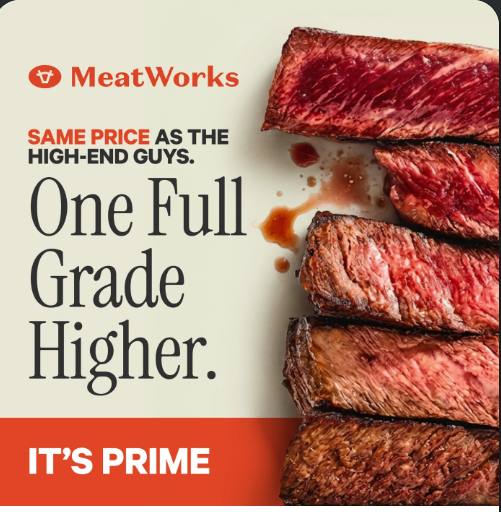
MeatWorks
8×
Revenue growth
Two distinct buyer groups surfaced by customer research, each with its own messaging, creative and campaign structure.
Without increasing ad spend
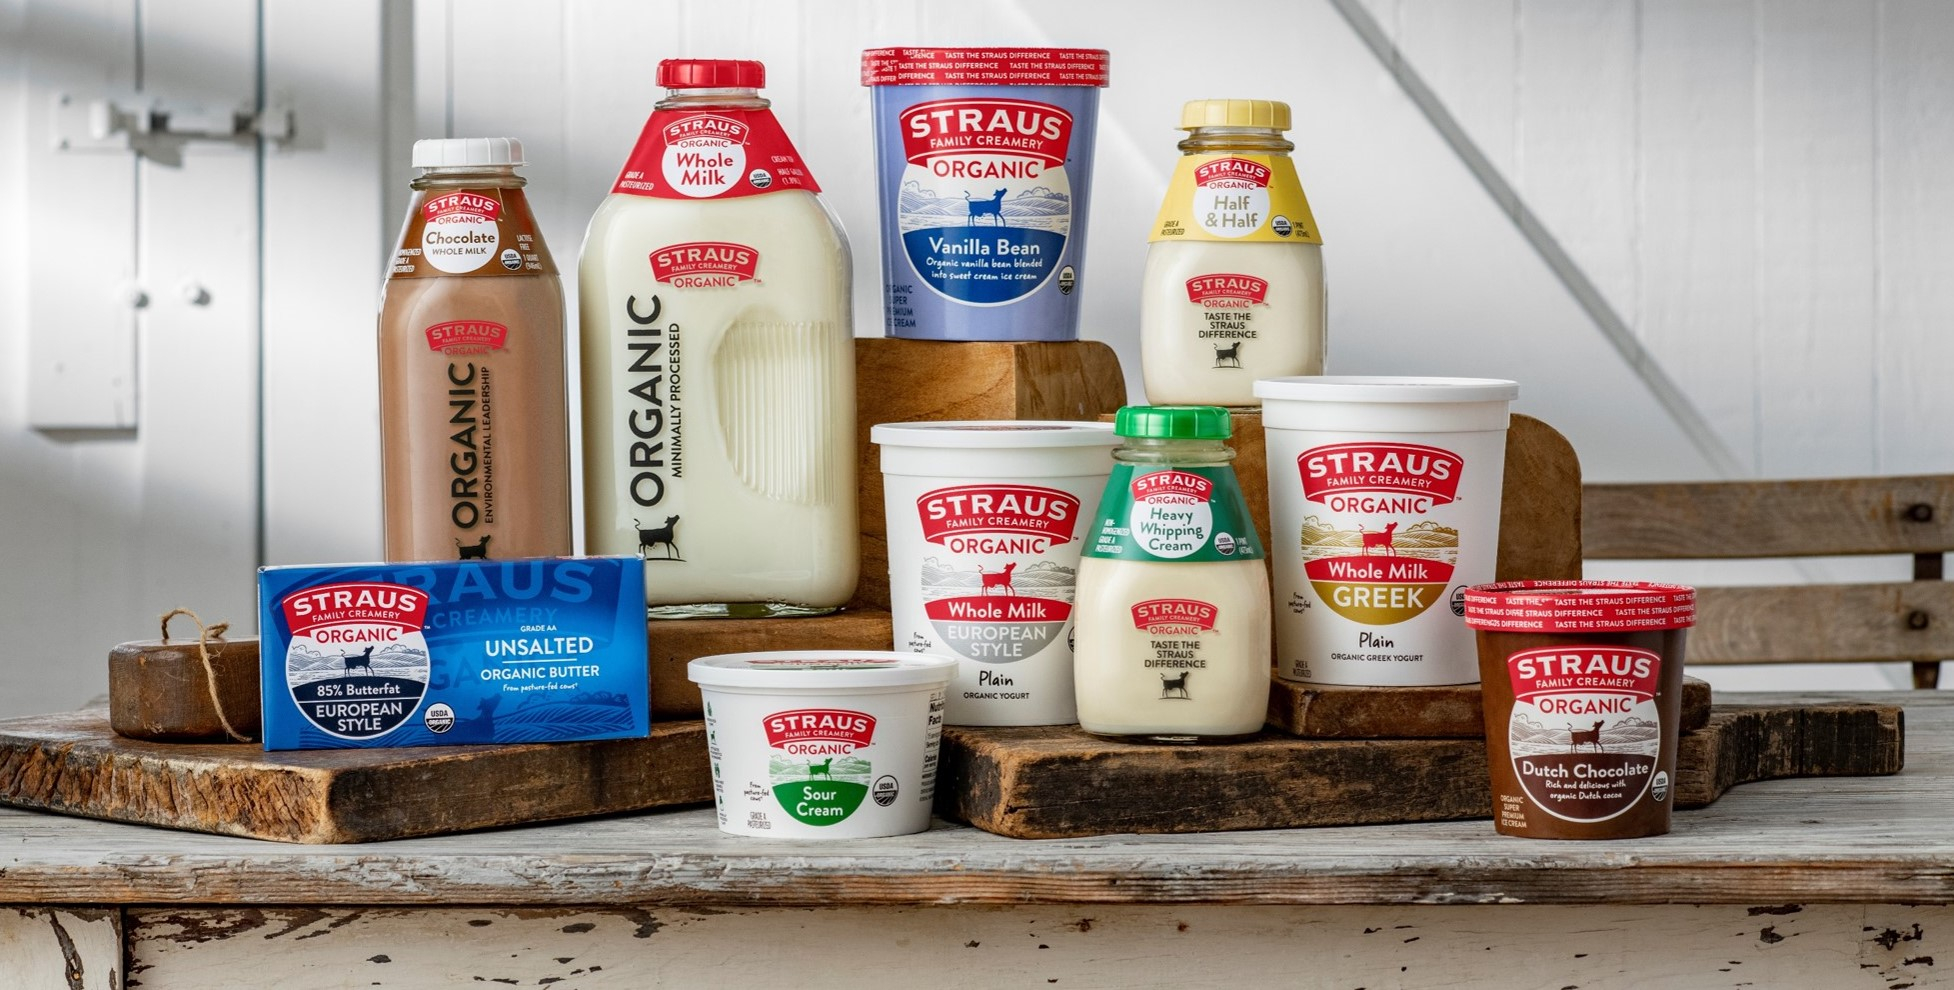
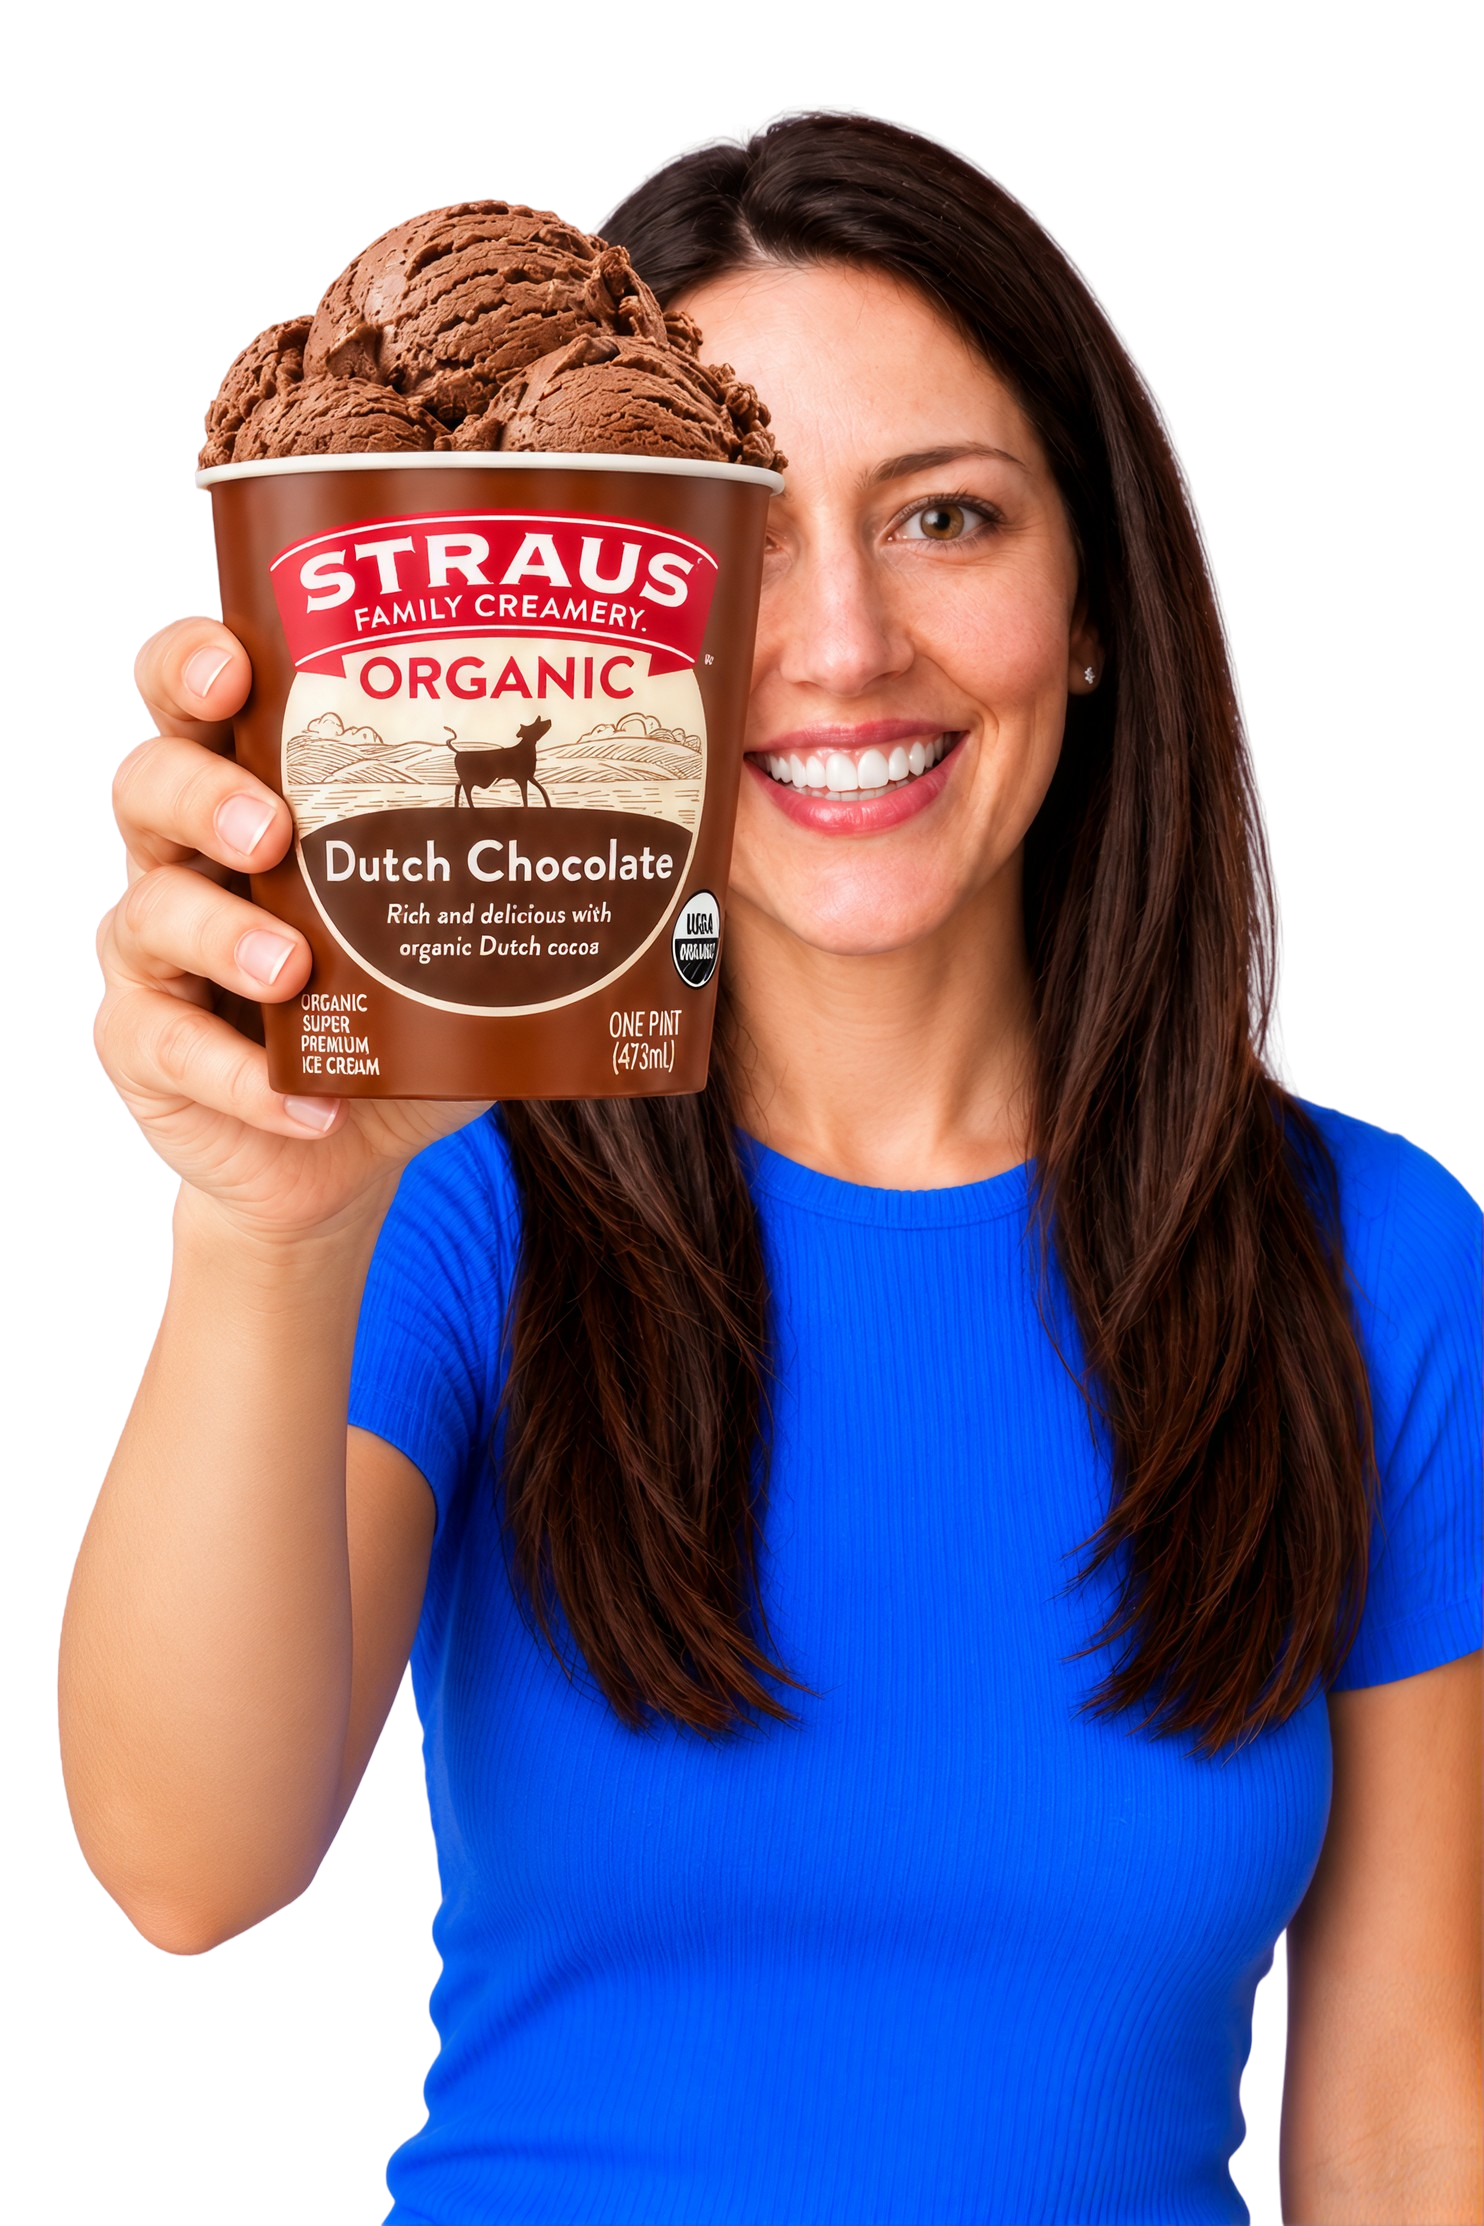
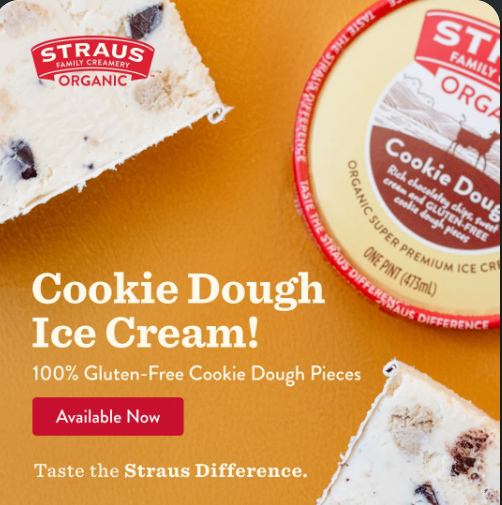
Straus Organic
118%
More monthly conversions in 6 months
Targeting and creative rebuilt around a specific buyer profile across Meta, Google and retail media.
Without increasing ad spend
Client engagement results using the Why People Buy Pyramid™. Results are not attributed to individual ads shown here, and are not promised by the free evaluation.
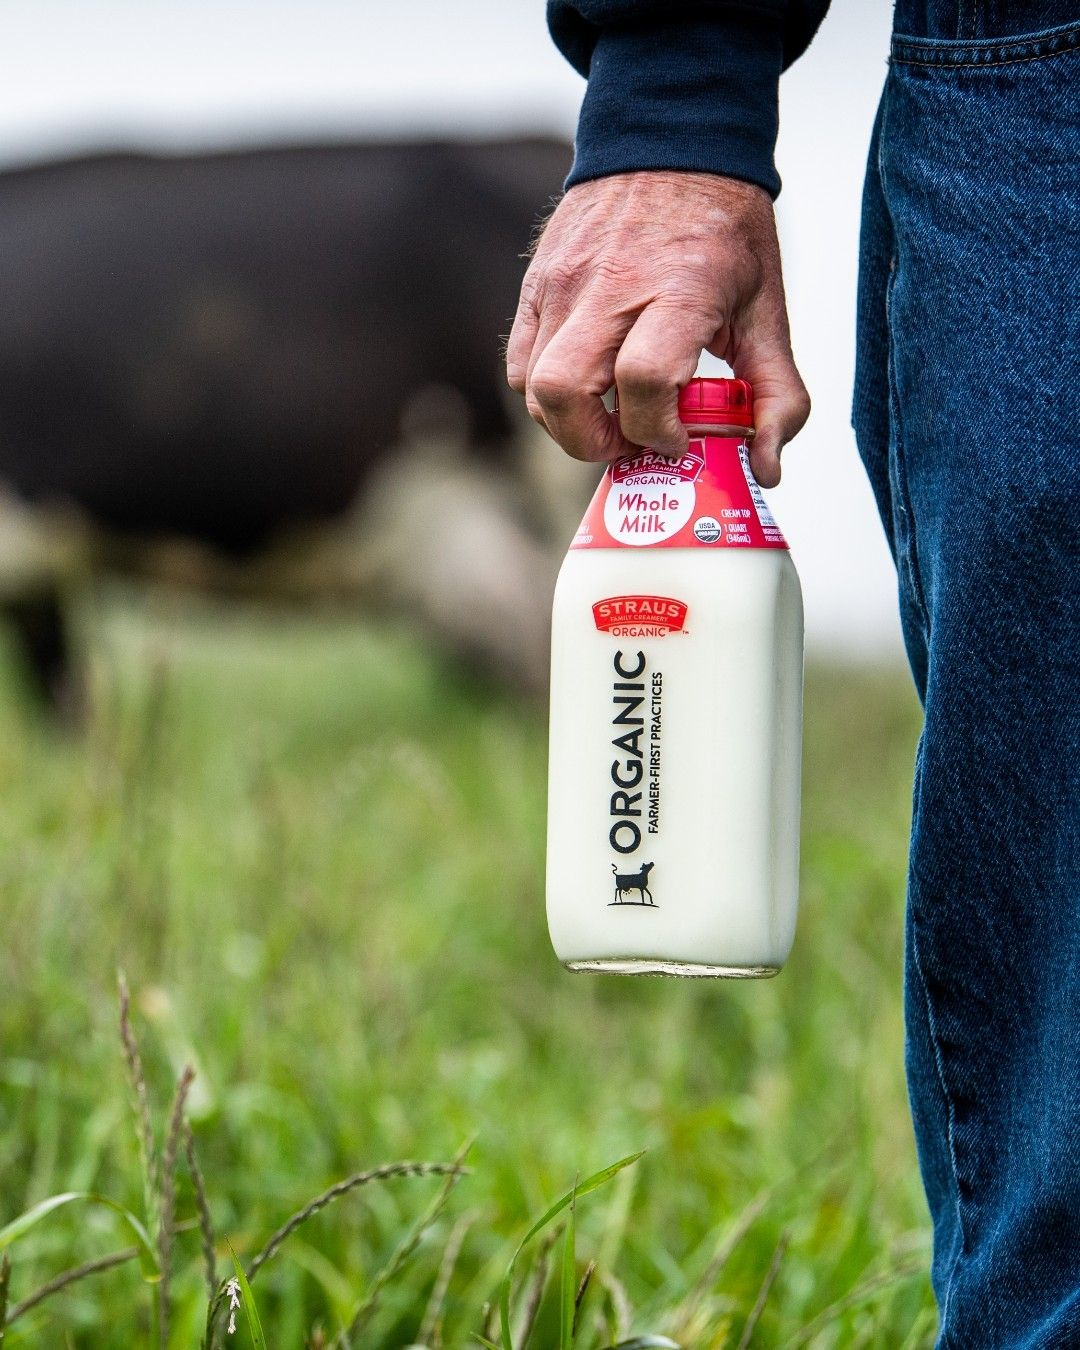
“Schaefer has been a game changer for our digital marketing strategy.”
 Meryl MarrVP Marketing, Straus Family Creamery
Yes. One platform, one evaluation, no cost and no obligation. We do it because the findings are the clearest argument we have for how we work.
No. You can share exports or read-only access, whichever your team prefers. We tell you exactly which fields we need.
Five business days from the point we have your platform data and customer information. We confirm the KPI with you before we start.
You keep the one-pager and the recommended test either way. We only work with food & beverage brands, so we say so early if it is not a match.
Who we are
We advertise everywhere people decide what to eat and drink: social, search, AI assistants, retail media, Amazon, Walmart and streaming TV.
Food and drink is all we do. 19+ brands.
We research why people buy.
The technical side and the algorithms.
The right ad for the right buyer.
Senior people, same-day answers.
2,121
food & beverage brands tracked
409,000+
ads analysed
129
Why People Buy drivers
Straus: −60% CPA, 5× ROAS and +118% monthly conversions in the first six months.
Intelligence → Strategy → Execution, starting with a 30-day sprint.
Real findings, names removed · both engines
Not a checklist of settings. A clear read on where your money goes, why buyers choose you, and what to fix first.
Specialty pantry brand · ~$20M revenue · Google Ads
$41 → $96
cost per sale, spring to fall
2.9× → 1.2×
ad return over the same period
80%
of fall spend in campaigns returning 0.6×
1 · Why People Buy™ problem
Ads mixed different buying reasons (recipes, gifting, everyday staples) on one page, so shopper intent never matched the landing page.
2 · ROAS cost
Five campaigns bid against each other. $24K wasted and ROAS fell from 2.9× to 1.2×.
3 · Combined fix
Match each ad to one buying reason and merge into one clean Performance Max structure.
Same products, five campaigns
Dark band: flagship products every campaign bid on. $24K spent on the overlap.
Ad return
What we found
The same flagship products ran in 2 Performance Max and 3 Shopping campaigns at once. $24K went to the overlap at 0.4× return.
Google rated every ad group Excellent, yet they ran 18-month-old creative, mixed products on one page and had no gift ads going into the holidays.
Free tasting sign-ups and test actions were counted as purchases, so Google optimised toward people who never bought.
The two campaigns driving most revenue were switched off in late summer and budget moved to new tests.
The one-page fix plan
Brand names removed and figures rounded to protect client confidentiality.
Tell us about your brand and the platform you'd like evaluated. We follow up to confirm your KPIs and the platform and customer information needed for your one-page evaluation.